Objective
In this lab, you will gain hands-on experience with the LLVM compiler framework through three interconnected objectives. First, you’ll learn to read and write LLVM IR, the intermediate representation that serves as the foundation for program analysis and transformation in LLVM. Second, you’ll use the LLVM API to write passes that analyze and modify programs, giving you practical experience with the tools used in modern compiler development. Finally, you’ll explore the fundamental differences between static and dynamic program analysis by implementing both types of analyses for the same program properties.
Pre-Requisites
Before starting this lab, you must read the LLVM Primer. Part I provides an overview of the LLVM framework, while Part II explains the structure of LLVM IR - both are essential for completing the first part of this lab. Keep Part III (The LLVM API) readily available as a reference guide for the API calls you’ll use throughout the lab. This primer will also be valuable for debugging and understanding LLVM IR in future labs.
Setup
Begin by opening the lab2 folder in VS Code. You can do this either through the VS Code interface using ‘Open Folder’ or via the terminal:
code <lab2 directory>
Make sure Docker is running on your machine, then open the VS Code Command Palette and search for “Reopen in Container”. Select this option to set up the development environment. The skeleton code for Lab 2 will be located under /lab2 in the container environment.
Once your environment is ready, build the initial project structure:
cd /lab2
mkdir -p build && cd build
cmake ..
make
This build process creates several important files in the /lab2/build directory. You’ll see two LLVM passes: StaticAnalysisPass.so and DynamicAnalysisPass.so, which you’ll be modifying throughout this lab. The build also produces libruntime.so, a runtime library that provides functions used for dynamic instrumentation.
Part 1: Understanding the LLVM IR
Task: Write C programs that generate specific LLVM IR patterns by reverse-engineering provided LLVM IR files.
Step 1: Exploring LLVM IR Generation
The LLVM IR is a low-level representation that sits between high-level source code and machine code. To understand how C programs translate to LLVM IR, you’ll use clang to compile sample programs. Navigate to the test directory and try generating LLVM IR:
cd /lab2/test
clang -emit-llvm -S -fno-discard-value-names -c simple0.c
This command uses several important flags. The -S flag instructs clang to perform only preprocessing and compilation steps, while -emit-llvm generates LLVM IR instead of assembly code. The output is saved to simple0.ll. The -fno-discard-value-names flag is particularly useful for learning, as it preserves variable names in the generated LLVM IR, making it much more readable.
Take time to examine the generated simple0.ll file and compare it with the original C code. Notice how C constructs map to LLVM instructions, how types are represented, and how control flow is handled.
Step 2: Reverse Engineering LLVM IR
To deepen your understanding of LLVM IR, you’ll now work in reverse - writing C programs that generate specific LLVM IR. The /lab2/ir_programs directory contains several LLVM IR files, and your task is to write corresponding C programs in the /lab2/c_programs directory.
cd /lab2/c_programs
clang -emit-llvm -S -fno-discard-value-names -c test1.c
diff test1.ll ../ir_programs/test1.ll
The diff command will show any differences between your generated IR and the target IR. Your goal is to have no differences. For convenience, the Makefile automates this process:
make test1
This exercise requires careful attention to detail. Small differences in C code can produce different LLVM IR, so you’ll need to match the exact structure of the target IR files. This hands-on experience will prove invaluable when debugging LLVM passes later in the course.
Part 2: Understanding the LLVM API
Task: Implement static and dynamic analysis passes using the LLVM API to detect and analyze binary operators in programs.
Step 1: Build System Setup
This lab uses CMake, a modern build system generator that’s widely used in C++ projects. If you’re unfamiliar with CMake, consider reading the CMake tutorial, particularly Steps 1 and 2. CMake generates a Makefile that you can use for subsequent builds. After modifying source files, you need only run make to rebuild your project - there’s no need to run cmake again unless you modify the CMakeLists.txt file.
The workflow for this part of the lab follows the diagram below, moving from left to right through compilation, analysis, instrumentation, and execution phases:
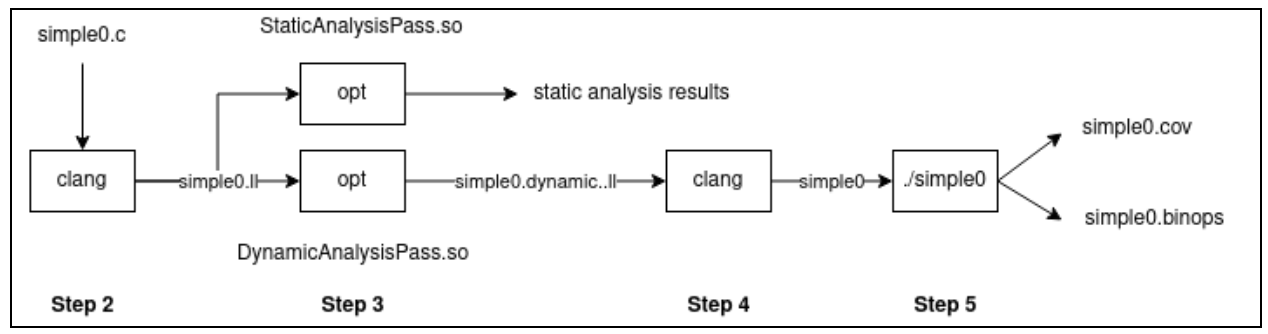
Step 2: Compiling to LLVM IR with Debug Information
The LLVM passes you’ll implement operate on LLVM IR, so you must first compile C programs to this intermediate form. Additionally, you’ll need debug information to map LLVM instructions back to source code locations:
cd /lab2/test
clang -emit-llvm -S -fno-discard-value-names -c -o simple0.ll simple0.c -g
The -g flag is crucial here - it includes debug information that your passes will use to report line and column numbers from the original C source.
Step 3: Running the Static Analysis Pass
The static analysis pass examines the program without executing it. Run the provided skeleton pass using the opt tool:
opt -load-pass-plugin=../build/StaticAnalysisPass.so -passes="StaticAnalysisPass" -S simple0.ll -o simple0.static.ll
The opt tool is LLVM’s optimizer and analyzer. The -load-pass-plugin option loads your pass library, while -passes="StaticAnalysisPass" specifies which pass to run. The current skeleton implementation reports the location of all instructions. After you complete your implementation, it will also identify and report binary operators. For now, the output program simple0.static.ll should be identical to the input, as this pass only analyzes without modifying the code.
Step 4: Running the Dynamic Analysis Pass
The dynamic analysis pass instruments the program to collect runtime information:
opt -load-pass-plugin=../build/DynamicAnalysisPass.so -passes="DynamicAnalysisPass" -S simple0.ll -o simple0.dynamic.ll
Unlike the static pass, this creates a modified program in simple0.dynamic.ll. The skeleton implementation adds calls to track instruction coverage. You can verify the modifications using diff:
diff simple0.dynamic.ll simple0.ll
Step 5: Creating and Running the Instrumented Executable
To see the dynamic analysis in action, compile the instrumented program and link it with the runtime library:
clang -o simple0 -L../build -lruntime simple0.dynamic.ll
./simple0
When you run the instrumented program, it creates output files tracking execution. The skeleton generates simple0.cov with coverage information. After you complete the implementation, it will also generate simple0.binops with binary operator execution data.
Lab Instructions
Static Analysis Implementation
Your first task is to extend src/StaticAnalysisPass.cpp to identify and report binary operators. The skeleton code already iterates through all instructions and reports their locations. Study this code carefully to understand how the LLVM API works - notice how it traverses functions and instructions, and how it extracts debug information.
Within the instruction iteration loop (around line 34), you need to detect binary operators and print information about them. A binary operator in LLVM represents operations like addition, subtraction, multiplication, and division. To check if an instruction is a binary operator, use LLVM’s dynamic casting:
if (BinaryOperator *BinOp = dyn_cast<BinaryOperator>(&Inst)) {
    // This instruction is a binary operator
}
For each binary operator, print its type, location, and operands in this exact format:
Division on Line 4, Column 13 with first operand %0 and second operand %1
The Utils.h file provides helpful functions for this task. The getBinOpSymbol function returns a character representing the operator (like ‘/’ for division), while getBinOpName converts this to a readable string (like “Division”). The variable function extracts the name of an operand from its LLVM Value representation. You can access the operands of a binary operator using getOperand(0) for the first operand and getOperand(1) for the second.
After completing your implementation, the output for simple0.c should include both the instruction locations (already provided) and your binary operator analysis:
Running Static Analysis Pass on function main
Locating Instructions
2, 7
2, 7
3, 7
3, 7
4, 7
4, 11
4, 15
4, 13
Division on Line 4, Column 13 with first operand %0 and second operand %1
4, 7
5, 3
Notice that multiple LLVM instructions can map to the same source location. This happens because a single line of C code often translates to multiple LLVM instructions.
Dynamic Analysis Implementation
The dynamic analysis task builds upon your static analysis by adding runtime instrumentation. You’ll modify src/DynamicAnalysisPass.cpp to instrument binary operators so they report their execution at runtime.
The skeleton code already demonstrates instrumentation by injecting calls to __coverage__ before each instruction. This function, defined in lib/runtime.c, records which lines of code execute. Study the instrumentCoverage function to understand how instrumentation works - it creates constant values for line and column numbers, builds an argument list, and inserts a function call.
Your task has two parts. First, in the main pass loop, detect binary operators (just as in the static pass) and call the instrumentBinOpOperands function.
Second, implement the instrumentBinOpOperands function. This function must inject calls to __binop_op__, which expects five arguments: the operator character, line number, column number, and the two operand values. A crucial insight for this implementation is that in LLVM, an instruction IS the variable it defines. When you see %result = add i32 %a, %b in LLVM IR, the add instruction itself represents %result. This means the operands of a binary operator can be passed directly as values to the instrumentation function.
Here’s the structure of your implementation:
void instrumentBinOpOperands(Module *M, BinaryOperator *BinOp, int Line, int Col) {
    // Get the context and types
    // ...

    // Create constant values for operator symbol, line, and column
    // Get the operands (remember: they ARE the values)
    // Build the argument vector
    // Insert the function call before the binary operator
}
After implementing both analyses, running the instrumented simple0 program produces two files:
# simple0.cov
2, 7
2, 7
3, 7
3, 7
4, 7
4, 11
4, 15
4, 13
4, 7
5, 3

# simple0.binops
Division on Line 4, Column 13 with first operand=3 and second operand=2
Understanding Static and Dynamic Properties
This lab illustrates a fundamental distinction in program analysis. Static properties are those that can be determined by examining the code without running it - the presence of binary operators, their types, and their locations in the source code. Dynamic properties emerge only during execution - which operators actually run, in what order, and with what values.
Both types of analysis provide valuable insights. Static analysis can find all potential issues in code, while dynamic analysis reveals what actually happens during specific executions. In subsequent labs, you’ll use both techniques to find bugs and generate test cases.
Important Notes and Tips
When implementing your passes, remember that not all LLVM instructions have debug information. Always check if debug information exists before using it. The skeleton code demonstrates this pattern.
If you encounter issues, add debugging output using outs() to understand what your pass is seeing:
outs() << "Instruction: " << Inst << "\n";
Pay careful attention to the exact output format required, as the autograder will check for exact matches.
Submission
After completing both parts of the lab, create your submission file:
cd /lab2
make submit
This creates a submission.zip file containing your implementations. Upload this file to Gradescope for grading.